Graphs + Jev

Turn connected evidence into bounded decisions.

Graphs keep the relationships between facts. Jev decides, from that evidence, whether an agent may answer, must ask, must refuse, or must hand the question to a person.

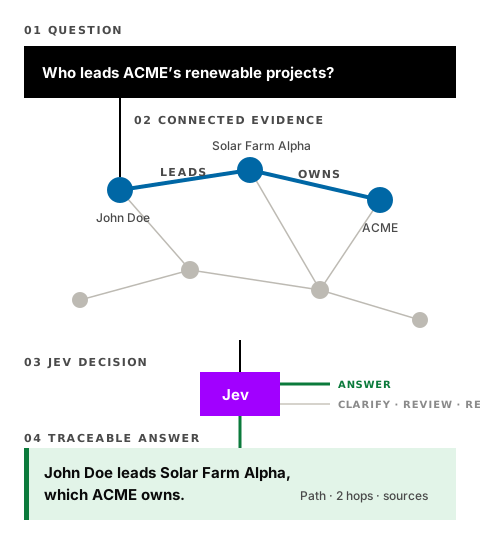
A question passes through connected facts. A two-hop path from John Doe to ACME is highlighted, Jev chooses Answer, and the answer returns with its path and sources.
The concept in 60 seconds

Three steps from a question to a decision you can check.

Before any of this, the evidence has to be within reach. RAG retrieves indexed documents; MCP connects an AI application to governed tools and live systems. Both put material in front of the model, but neither shows how the pieces relate or whether they are enough to answer. That is where graphs and Jev come in. See all four layers in the DCCEEW story.

  1. Connect the evidence

    Which facts actually bear on this question?

    The graph starts at the people, places or things the question names and follows their relationships a short distance. It returns connected facts, not passages that merely sound similar.

  2. Control the decision

    Is that evidence enough to act on?

    Jev checks the evidence against typed rules. It answers only when the evidence supports one. Otherwise it asks a clarifying question, refuses, reports no data, or passes the case to a person.

  3. Show the reasoning

    Why should anyone trust the result?

    Every outcome comes back with the short path and the sources behind it, so a reviewer can see exactly which facts led to the decision.

RAG
Retrieval-augmented generation: search an index of documents and add the best passages to the model's prompt. A technique for finding things.
MCP
Model Context Protocol: an open standard for connecting an AI application to tools, resources and live systems. A way of connecting to things.
Graph
Facts (nodes) and the typed relationships between them (edges), such as John Doe leads Solar Farm Alpha.
Graph database
The store that holds a graph and answers questions by following relationships. Neo4j and Google Cloud Spanner Graph are examples. These demonstrations keep a small graph in memory instead.
Jev
The typed decision layer. It decides what an agent may do with the evidence. It is not the database and does not store facts.
Guided example

Follow one question through the graph.

Choose a question. The graph highlights the facts that connect it, and the result shows what Jev decides and why. This runs in your browser on a twelve-fact sample graph; no model or database is called.

Choose a question

Choose a question to see its evidence path.

Hop depth

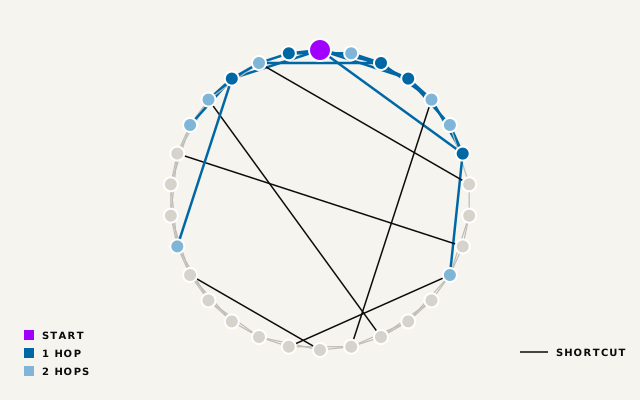
A hop is one relationship. Each extra hop reaches more connected facts and uses more of the agent's context. Numbers on the nodes show how many hops away they are.

Use cases

Three demonstrations of the same pattern.

Each one asks a real question, builds or reads a graph, and lets Jev decide what to return. Two use deterministic representative evidence in the browser; the third explains why short graph neighbourhoods are enough.

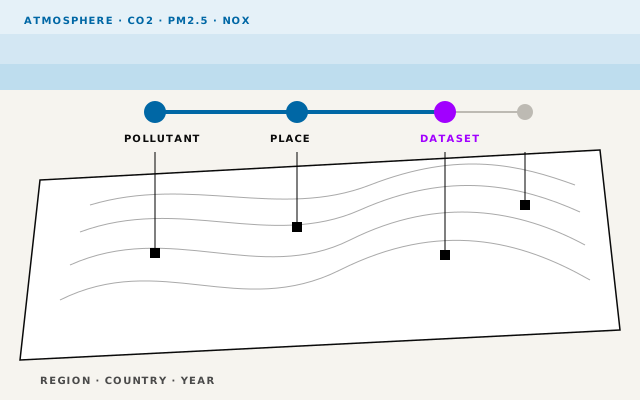
DCCEEW catalogue discovery

Department of Climate Change, Energy, the Environment and Water (DCCEEW)

Business question
Which official datasets answer this emissions request?
What the graph adds
Links pollutants, places, years and breakdowns to the datasets that hold them.
What Jev controls
Answers only when a dataset covers the request; otherwise it asks, rejects or reports no data.
The full story
How RAG and MCP bring evidence within reach, and where graphs and Jev take over.
Open the DCCEEW story and demo
Parkinson’s research evidence

Parkinson’s research evidence

Business question
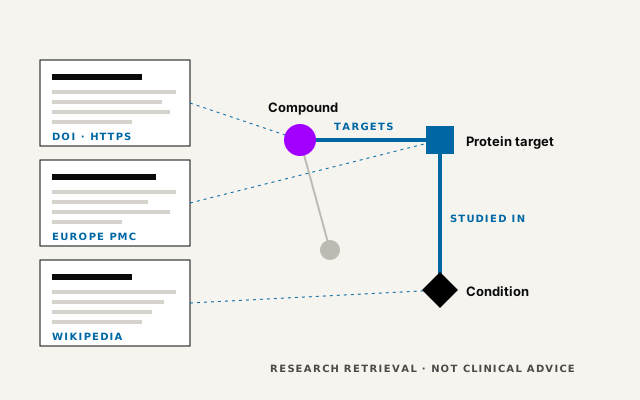
What has published research reported about this mechanism or compound?
What the graph adds
Turns retrieved publications into typed links between compounds, targets and conditions, each pointing back to its source.
What Jev controls
Refuses diagnosis, prescribing and dosing before any search, and asks for clarification when sources do not state a relationship.
Open the Parkinson’s demo
Small-world context

Little Bunnies: why two hops are usually enough

Business question
How much connected context does an agent need before it can decide?
What the graph adds
Short paths. In a small-world network, a few hops reach most of the graph.
What Jev controls
Keeps the decision state inside a fixed token budget, so context stays bounded.
Open Little Bunnies
Trust and deployment

Built to show its working, and to say no.

  • TraceableEvery outcome returns the path and the sources behind it.
  • Bounded outcomesAnswer, clarify, reject, review or no data. Nothing in between.
  • Refusal before retrievalRequests outside scope, such as a medication dose, stop before any search runs.
  • Portable publicationStatic files with no cloud SDK or server dependency. The same publication runs on GitHub Pages or any static host.
  • No runtime egressNo hosted model, API, analytics or live research search is called. External source links open only when you choose them.
  • No raw personal dataThe demonstration graphs hold no personal data, and the static publication does not log request text.

Scope: the browser demonstrations use deterministic catalogue rules and an in-memory graph. They are not a production graph database, and the Parkinson’s page is not clinical decision support.

Technical guide

For technical advisers: engines, labs and queries.

Graph database grades and costs, runnable retrieval and decision labs, the same query in five dialects, and local-run commands. Covers Neo4j, FalkorDB, Memgraph, Amazon Neptune, Spanner Graph, PuppyGraph, Microsoft Fabric Graph, MongoDB Atlas, Azure Cosmos DB and Kuzu.

GCP event spotlight

Google Cloud Spanner Graph

One database. Relational and graph views.

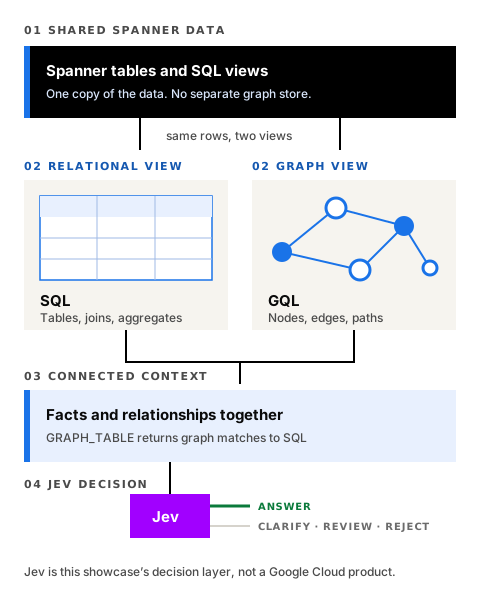
Spanner Graph maps Spanner tables or SQL views into a property graph without creating a separate copy of the data. Teams can use GQL for graph patterns, SQL for relational work, and combine both when a decision needs connected and tabular context.

  • Google Cloud describes it as multi-model: a property graph schema is defined declaratively over existing tables or views. It needs the Enterprise or Enterprise Plus edition.
  • Graph queries use an ISO GQL-compatible interface.
  • GoogleSQL can read graph matches through GRAPH_TABLE, so graph and relational results meet in one query.
  • The graph inherits Spanner’s scale, availability and strong consistency.

Capabilities are summarised from Google Cloud documentation. The grades and scores below are this site’s independent judgement; this spotlight does not change them.

Diagram: Spanner tables and SQL views hold one copy of the data, exposed both as a relational view queried with SQL and as a property graph queried with GQL. Together they give connected context to Jev, which answers, clarifies, sends for review or rejects.

Strong fit

  • Operational data already lives in Spanner.
  • The application needs relational and relationship queries over the same data.
  • Strong consistency and managed multi-region operation matter.
  • The organisation prefers a managed Google Cloud database platform.
  • Graph context should stay next to transactional facts, not in a separately synchronised store.

Consider carefully

  • It is a Google Cloud service, not a portable or embedded database.
  • Cost and capacity follow the Spanner operating model.
  • Validate schema mapping, query shape, latency and traversal depth with representative data.
  • Test the GQL features and graph algorithms you need; do not assume parity with graph-native products.
  • A dedicated graph store may still suit some graph-first workloads better.
Engine grades and scoresEach engine graded against the job it is built for.

An embedded library and a clustered service do different jobs. Weights: traversal depth 30%, operations 25%, total cost 20%, vendor viability 15%, fit for decision-model state 10%.

Native graph store Graph over existing data Document store with graph features Embedded

Scores by criterion

Scores are out of 5 and are judgement, not measurement. PuppyGraph's depth score rests on vendor figures that have not been independently verified.

Entry production costApproximate monthly list prices in USD, as at 25 September 2026; Spanner Graph checked 2 October 2026.

The paler bar shows a range. Duplication and sync costs for native stores are not included, and are often the larger number.

Browser labsHybrid text against graph retrieval, token budgets, and calibrated thresholds.

Each lab runs in your browser on the same sample graph as the guided example. Change the settings, or open the code, edit it and run your version.

Lab 1: hybrid text retrieval against graph retrieval

The text baseline is what most teams already run: BM25 over each node's text, fused with dense similarity from a small embedding model (all-MiniLM-L6-v2) by reciprocal rank fusion. Dense similarities are precomputed for the questions in the list; for a question you type yourself, the text side falls back to BM25 alone. Graph retrieval starts at the entities named in the question and follows relationships.

View and edit the code

Lab 2: fit the best context into a token budget

Personalised PageRank ranks nodes by how central they are to a starting entity, then the highest-ranked text is packed into the budget. Jev takes about 64,000 tokens a request, of which about 32,000 for the state and the longest question; this example graph is tiny, so the budget is scaled down.

View and edit the code

Lab 3: calibrated decisions with per-action thresholds

A simulation of the decision loop described in the paper. No model is called. Each case gets a stated confidence; the case is decided automatically if confidence clears that action's threshold, otherwise it is escalated at a cost of 1. Raise overconfidence to see what happens when stated probabilities stop matching reality.

View and edit the code
One question, five dialectsWhich projects does John Doe lead, and who owns them?

Run it on your laptopLocal options for the engines that have them.

Neptune, Spanner Graph and Fabric graph are cloud-only.

Sources and caveats

Prices are vendor list prices checked on 25 September 2026 and change often; confirm with each vendor's calculator before quoting to a client. Memgraph was checked on 30 September 2026. Spanner Graph was checked on 2 October 2026: Enterprise edition in us-central1 is $0.41 per replica hour, three replicas per regional node, so $1.23 per node hour; over 730 hours that is about $90 for 100 processing units and $898 for one node, before storage, backups and network. Performance claims for PuppyGraph, FalkorDB and Jev are vendor-reported. Kuzu was archived in October 2025; the forks named here are community-maintained. Grades are the author's judgement against the stated weights.

Vendor pages: Neo4j, FalkorDB, Memgraph (Community licence: BSL 1.1, production use for internal purposes, no database-as-a-service; each version becomes Apache 2.0 on the change date in its licence, at most four years after its release), Neptune, Spanner pricing (capabilities: Spanner Graph overview, graph queries, what is a graph database), PuppyGraph, Fabric graph, MongoDB, Kuzu status.